Same Street, Two Markets: The Hidden Split In Oakville's Neighbourhood Data
August 20, 2026
August 20, 2026
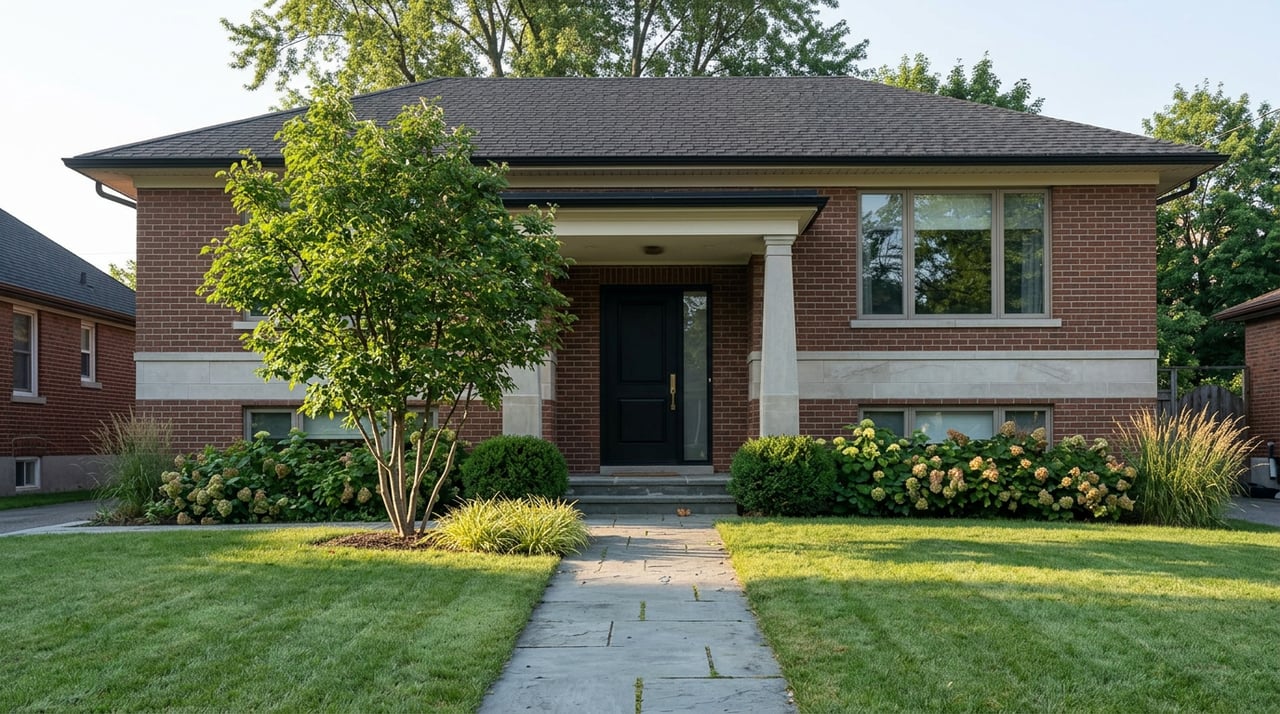
Walk down a street in Sixteen Hollow this summer and you would not guess that two completely different housing markets are running underneath it. Detached homes there sit near the bottom of Oakville's growth rankings, 19th out of 22 comparable neighbourhoods as of July 2026. Condos in the same pocket rank 2nd out of 21, with values up 8.82 percent over the same period. Same postal code, same school catchment, same distance to the same grocery store. Two markets moving in opposite directions.
This is the detail that gets lost when a buyer or seller compares Oakville neighbourhoods by scrolling an average price. The average blends house and condo sales into one number, and in a lot of Oakville pockets right now, that number is hiding more than it reveals.
Sixteen Hollow is not an outlier. Uptown Core shows the same pattern in miniature. Houses there rank 18th of 22 for growth, with the benchmark house price sitting at $940,843 and homes selling in about 7 days but closing at roughly 98.75 percent of list, a sign buyers are negotiating rather than bidding blind. Condos in Uptown Core rank 6th of 21, up 2.80 percent, with a monthly rental estimate around $2,848 that keeps investor interest alive even while the house side cools.
Clearview runs the exact same divergence in reverse. Houses there rank 3rd of 22, near the top of the city, with the predicted market value climbing to $1,504,503 against a three-month average of $1,481,792. Condos in Clearview rank 20th of 21, near the very bottom, even though the headline HonestDoor price shows a startling 44.16 percent jump to $833,984. The predicted market value tells a different story at $578,532, down from a three-month average of $649,172, a real shift of negative 25.09 percent.
Three neighbourhoods, three versions of the same fact: house performance and condo performance in Oakville are not the same market wearing two labels. They are two separate markets that happen to share an address.
| Oakville Pocket | House Growth Rank | Condo Growth Rank | What's Actually Happening |
|---|---|---|---|
| Sixteen Hollow | 19 of 22 | 2 of 21 | Condos far outpacing houses |
| Uptown Core | 18 of 22 | 6 of 21 | Condos outpacing houses |
| Clearview | 3 of 22 | 20 of 21 | Houses far outpacing condos |
| Iroquois Ridge (South) | 8 of 22 | 7 of 21 | Both above average, moving together |
| QEW East Industrial District | 1 of 22 | 2 of 21 | Both near the top, moving together |
| Joshua's Meadows | 15 of 22 | 15 of 21 | Both below average, moving together |
(Rankings reflect HonestDoor's neighbourhood-level growth tracking for June and July 2026.)
The mechanism behind this split is not mysterious once you look at who is buying each product. Detached houses in Oakville are largely an end-user market: families who want a specific school boundary, a specific lot, a specific commute. That buyer pool is smaller, more selective, and slower to move on price.
Condos and lower-priced townhomes draw a different pool entirely, first-time buyers stretching to get into Oakville at all, and investors chasing rental yield. Financing shapes this too. The federal insured mortgage cap rose to $1.5 million effective December 15, 2024, which meant buyers with less than 20 percent down could suddenly qualify for insured financing on homes that previously required a conventional down payment. That change widened the pool of eligible buyers for mid-priced detached product in some pockets while doing little for the condo segment, where prices were already well under the old $1 million threshold. Two products, two buyer pools, two sets of financing pressure. It should not surprise anyone that they move on different clocks.
Rental yield adds another layer. Sixteen Hollow's condos carry a yield around 4.02 percent, and that number alone pulls in a category of buyer who does not care what the detached market on the same street is doing. Investor demand can push a condo growth rank into the top tier even while the house market next door is flat or softening.
The divergence is real, but it is not universal, and the exceptions matter as much as the pattern. In Iroquois Ridge (South), houses rank 8th of 22 and condos rank 7th of 21, both comfortably above average. In the QEW East Industrial District, houses rank 1st of 22 for growth and condos rank 2nd of 21, both near the very top of the entire city. In Joshua's Meadows, both segments rank in the bottom half, houses at 15th of 22 and condos at 15th of 21.
These three pockets tell you something the divergent ones don't: when a neighbourhood's fundamentals (transit access, land supply, proximity to premium pockets) are strong enough or weak enough, they pull both property types along together. The split only shows up in the middle tier, where one segment has room to run and the other does not.
Midtown Core is the clearest case of a headline number actively misleading a reader. The average house price there shows a 3.35 percent increase to $4,692,876, which on its face looks like a strong market. But the predicted market value sits at $4,540,615, already sliding below the three-month moving average of $4,637,170, with recent price movement down 2.80 percent. The growth rank confirms it: 20th of 22 in Oakville, near the bottom.
The condo side is worse if you only read the top line. HonestDoor's price for Midtown Core condos jumped 28.89 percent to $679,046, a number that looks like a screaming buy signal. The predicted market value tells the opposite story at $526,843, well below the three-month average of $598,657, with a real shift of negative 18.34 percent. Condos here rank 19th of 21 in the city.
The lesson isn't that Midtown Core is a bad market. It is one of Oakville's most expensive addresses and will always draw a certain buyer regardless of monthly swings. The lesson is that a single percentage change, especially a big one, is often the least reliable number on the page. Predicted value against the three-month average and the neighbourhood growth rank are the two figures that actually tell you which direction a segment is heading.
If you're weighing Oakville against another GTA municipality, or weighing two pockets within Oakville against each other, the average price on a portal listing is the least useful number available to you. Here's what actually helps:
None of this replaces a conversation grounded in your specific budget, timeline, and property type. But it changes the question you should be asking. Instead of "is Oakville a good market right now," the sharper question is "is the specific property type I'm buying, in this specific pocket, moving in the direction I need it to."
If you're comparing Oakville pockets against each other, or against Burlington or Milton, and want the growth-rank and predicted-value picture for the specific property type you're considering, Team Durrani can walk through the current numbers pocket by pocket. Schedule a Consultation to get a read on your specific target before you make an offer based on an average that may not apply to what you're actually buying.
Does a low growth rank mean I should avoid a neighbourhood entirely? Not necessarily. A low growth rank on the house side, like Uptown Core's 18th of 22, can pair with strong momentum on the condo side in the same pocket. The rank tells you about one property type's recent trajectory, not the neighbourhood's overall desirability.
Why do condo and house prices in the same neighbourhood sometimes move in completely opposite directions? The two segments usually attract different buyers. Detached homes draw end users tied to school catchments and lot size, while condos draw a mix of first-time buyers and investors focused on entry price and rental yield. Financing rules, including the insured mortgage cap that rose to $1.5 million in December 2024, affect these two buyer pools differently, which is part of why the segments can decouple.
Is a big headline percentage change a reliable signal on its own? Not by itself. Midtown Core's condo segment showed a 28.89 percent jump in one reporting period while the predicted market value was actually down 18.34 percent from the recent trend. The percentage change and the underlying value trend can point in opposite directions, so it's worth checking both before drawing a conclusion.
Stay up to date on the latest real estate trends.
Whether you're buying, selling, or investing, Team Durrani is ready to provide the expertise and dedication you deserve. Contact us today to begin a professional, transparent, and results-driven real estate journey.
Team Durrani
Address
17-1075 North Service Rd. W
Oakville, Ontario, L6M 2G2